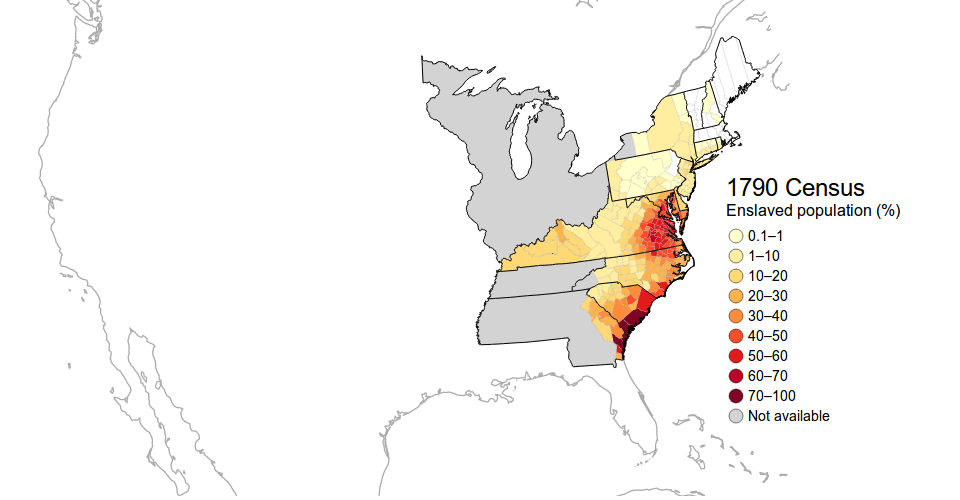
Slavery Here is a map from 1861 showing the slavery in Georgia. This map shows the spread of U.S. Slavery from 1790-1860. This animation shows the rate of slavery between 1790 and 1860 for enslaved people/mile. This animation shows the rate of slavery between 1790 and 1860 for the percent of population that is enslaved. Source: http://www.smithsonianmag.com/history/maps-reveal-slavery-expanded-across-united-states-180951452/ Share this:TwitterFacebookLike Loading...


